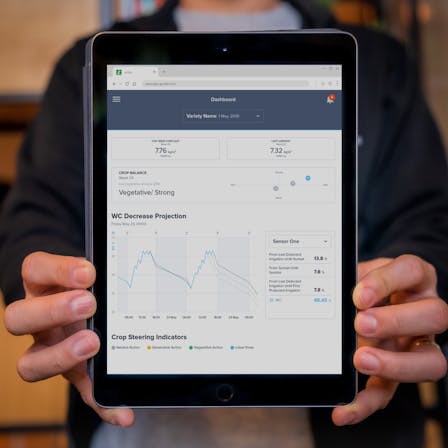
The Conditions Page gives you access to real-time root zone and climate data and visualizes your data in a simple overview with clear KPIs, all in one place. When the root and climate are analyzed together, instead of in different systems, we can quickly spot correlations between both parameters , resulting in more insights for better crop steering. Next to this, the page gives also predictions and notifications on how to improve irrigation strategy and rootzone management. The latest improvements on this page:
- More flexibility: a significant improvement to the Conditions Page is that your data will be shown on crop level, bringing it into alignment with the rest of the platform. This also means that KPIs on top will also be based on crop level. Still, you can analyse and compare performance of specific irrigation compartments which are linked to a crop. This allows you to more easily identify the factors affecting certain crops and zones. And you will have more flexibility in choosing different options on how to analyze the data on this page. The Grodan Grosens sensor data is now averaged every 3 minutes versus the precious 10 minutes.
- More climate insights: Another exciting addition is an important new climate data parameter: ‘Radiation Sum’. You will be able to analyse and compare the radiation sum with many other climate and rootzone parameters for specific crops in your account. This new climate parameter will help you to improve decision making in irrigation strategy and around nutrients management.
- Quicker access to predictions: A great highlight of the release is to have quicker access to popular ‘Projected WC Decrease’ feature. This valuable feature is unique to e-Gro and gives you more insights into whether you need to water your plant more or less before sunset. The WC Decrease will be more prominently visible at the top of the conditions graph so you can easily ‘toggle on and off’.
- Optimal user experience: The new release includes an easy to oversee time slider, which makes it possible to slide back 30 days on desktop along with clearer and more visible sensor data. You can see and compare far more than what was previously available.