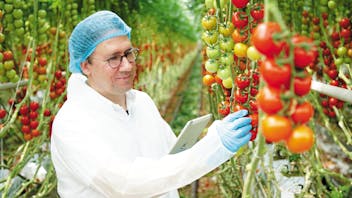

Water quality
Demineralised water has a value of 5 µS/cm, while well water, for example, has a value of 0.5 mS/cm, which implies that the amount of dissolved salts in it is 100 times greater. Water for making nutrient solutions and watering plants in the greenhouse is classified based on EC and ballast content.
| Class | EC (mS/cm) | Na or Cl (mmol/l) | NA (mg/L) | Cl (mgl/l) | Sustainability for hydroponic cultivation | Intended use |
|
1 | <0.5 | <1.5 | <34 | <53 | ++ | for each cultivation |
| 2 | 0.5-1.0 | 1.5-2.5 | 34-57 | 53-87 | + | not recommended for cultivation in closed nutrient solution systems |
| 3 | 1.0-1.5 | 2.5-4.0 | 57-92 | 87-142 | +/- | for cultivation resistant to salinity |
Tab.1. Water quality classification for greenhouse cultivation
Substrate salinity
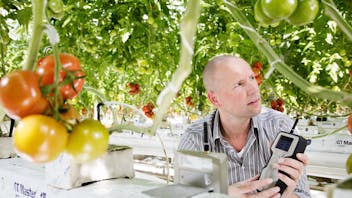
Monitoring substrate salinity levels and how they fluctuate during a day is a fundamental task for any grower. If the EC fluctuates between 0.3-0.8 mS/cm2 over 24 hours, the salinity is stable and no intervention is required. If the fluctuation is below 0.3 mS/cm2, this may indicate that the cultivation is being watered too much, among other things. Conversely, if the EC fluctuation reaches 1 mS/cm2 or more, it may mean that the amount of nutrient solution supplied to the plants is insufficient to meet their nutrient requirements.
The EC level of the substrate depends largely on the EC of the nutrient solution supplied and the efficiency with which the plants take up the nutrients.
*EC - electrolytic conductivity; synonyms: electral conductivity of water or conductance of water. It is measured using a conductivity meter, also known as an EC meter.
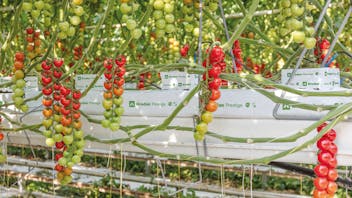
Preparation of the nutrient solution
When preparing the nutrient solution, mineral fertilisers are added to the water as a source of the nutrients required by the plants. The nutritional requirements of plants, balance between individual components and the final EC and pH values must always be considered. Water and low-quality fertilisers are a source of ballast components that are undesirable for the cultivation and affect the EC of the solution. When preparing and evaluating the nutrient solution, it should be assumed that the EC is formed only by the components required by the plants. In practice, the other ions should not be overlooked – an issue in Polish water is a high content of SO4-2 or Cl- ions, in the Netherlands a common problem is the level of Na+ cations, and in Hungary, for example, there is an over abundance of Mg+2 ions. Assessing the chemical composition of the nutrient solution, mat extract and the overflow provides a lot of information about plant growth and the effectiveness of the irrigation strategy adopted. In tomato growing, the standard EC of the applied nutrient solution is 2.8-3.3 mS/cm.
| W/m2 | Tomato | Cultivated species Cucumber | Peppers |
| 200 | 8 | 5 | 6 |
| 400 | 6 | 4 | 5 |
| 600 | 5 | 3.5 | 4 |
| 800 | 4 | 3.2 | 3.5 |
| 1000 | 3.8 | 3 | 3 |
Tab.2. EC levels (mS/cm) depending on the species grown and solar radiation intensity (W/m2)
In cucumber growing it is usually lower, 2.3-2.8 mS/cm. Growers using poorer quality water (e.g. quality class 3) for irrigation can maintain a slightly higher EC of the administered nutrient solution, but the substrate requires intense ‘refreshing’. In daily practice, it is also worth comparing the EC of the fed nutrient solution with the EC of the substrate. A difference of more than 1-1.8 mS/cm can cause physiological diseases and promotes the development of certain pathogenic fungi (for example those causing top and leaf necrosis, BER, grey mould).
At lower light intensity rates, higher EC levels in the mat are acceptable. A more intensive solar operation allows the grower to lower the concentration of ions in the substrate. Table 2 shows the substrate EC values for different greenhouse-grown plant species considered acceptable at specific levels of solar radiation intensity.
Increasing electrical conductivity of the root zone, especially in summer, can mean stagnation of the cultivation and strongly disrupt the balance between vegetative and generative growth. Plants become too generative, and the simultaneous heavy fruit load promotes weakening of the plant. Considerable electrical conductivity of the growing medium (>6mS/cm/cm) is most often the result of a poor irrigation strategy. The effect of ‘refreshing’ the growing medium depends mainly on the time and size of the first overflow.
It is also affected by the volume of the first irrigation cycles. With too low doses (less than 3% of the mat volume), the substrate can reach too high a moisture content (>85% WC). This can lead to the accumulation of so-called ‘old nutrient solution’ in the mats and it becomes more difficult to remove it.
Is the strategy effective?
To determine whether the irrigation strategy is suited to the needs of the plant and the current weather conditions, check the following (figure):
- light parameters (W/m2 and J/cm2) at the time of the first irrigation.
- light parameters (W/m2 and J/cm2) at the time of the first overflow.
- EC of the substrate at the time of maximum radiation during the day, which should then reach its lowest value.
- light intensity (W/m2) during the last irrigation cycle.
- the night-time drop in WC over the last few days – this should be stable.
Green: Solar radiation
Blue: Substrate WC
Red: Substrate EC
Fig. Chart showing the stable EC pattern over several days (day 1 - day 3). On a sunny day (day 2), the lowest EC was recorded at midday.
Evaluating the aforementioned parameters allows the right decision to be taken and appropriate changes to be made to the irrigation strategy.
To be remembered:
- Each day's overflow should occur at the appropriate time;
- Morning irrigation doses should be greater than 3% of the mat volume
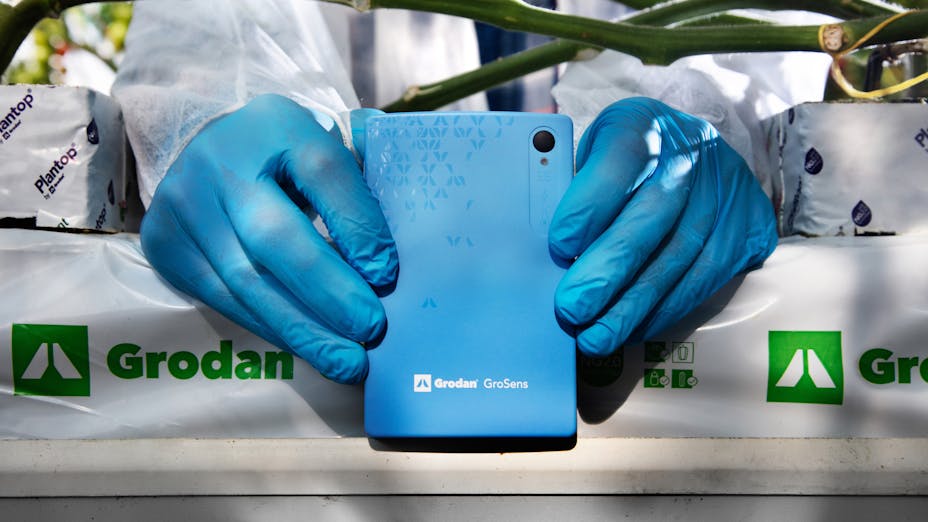
Would you like to know more about our New GroSens? Visit GroSens 2.2